


News


 中文
中文Center News and Events
- Update Date:2024-04-12
- Units:Center for Institutional Research and Data Analytics
Institutional Research Data Visualization Dashboards were officially launched.
Institutional Research Data Visualization Dashboards were officially launched.
The NYCU Center for Institutional Research and Data Analytics (CIRDA) is dedicated to visualizing research data at NYCU. Utilizing the research database, the Center integrates this data to create and display pertinent research charts and tables via visual dashboards, offering valuable references to relevant units. To create user-friendly experiences, the Center has integrated the campus portal to develop the “Institutional Research Data Visualization Dashboards” (hereinafter referred to as the integrated platform). The integrated platform was officially launched at the end of February 2024.
The Center has long maintained the Tableau visualization analysis software and established the Tableau Server on campus to facilitate the development and monitoring of the campus environment. This is in accordance with the current data use policy, which prohibits data from being transferred off-campus. Furthermore, with sponsorship from the alumni enterprise Advantech, the school has recently implemented the WISE-PaaS Industrial IoT Cloud Platform. The Center has commenced the first phase of application utilizing the platform's DataInsight integration service and Business Intelligence (BI) service. Recognizing the advantages of both visualization platforms, the Center continues to leverage both for the development of dashboards.
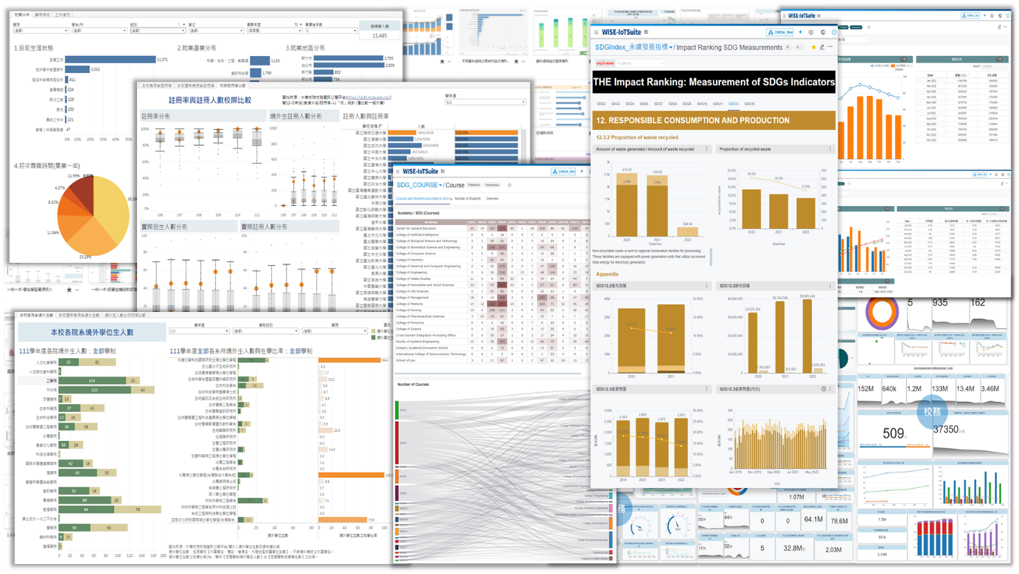
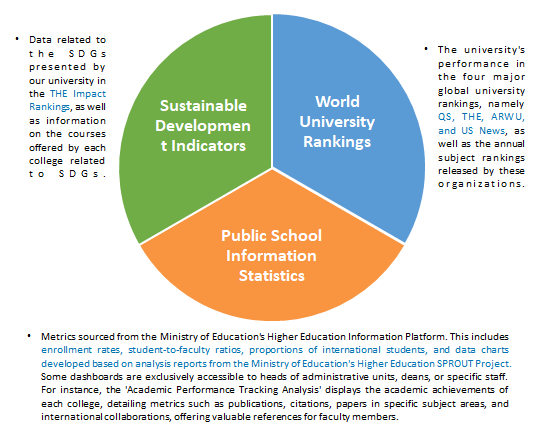
The platform offers eight primary categories of dashboards: World University Rankings, Public School Information Statistics, Graduate Destination Tracking Questionnaire Analysis, Academic Performance Tracking Analysis, Sustainable Development Indicators, Industry-Academia Collaboration Projects and Funding, Adaptive Talent Selection Support Data, Status of Assistance for Disadvantaged Students. The dashboard categories currently accessible to all faculty and students include World University Rankings, Sustainable Development Indicators, and Public School Information Statistics.
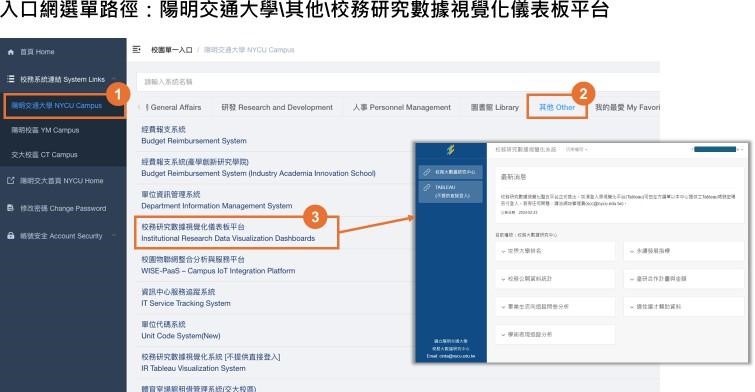
Access the dashboard via the NYCU portal: NYCU Campus -> Other -> Institutional Research Data Visualization Dashboards.
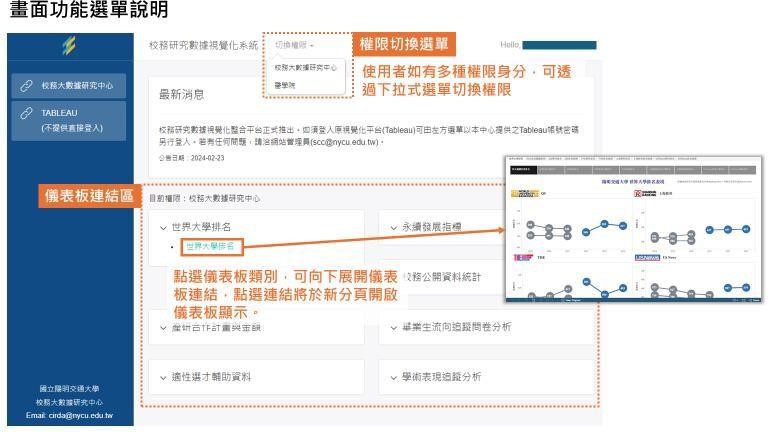
The system assigns dashboard permissions based on the user's role within the portal. If a user has multiple roles, they can switch between permissions using the menu.
Related Image(s):
Related Link(s):


